Hard to reproduce
Startup failures, regressions, and intermittent macOS behavior often disappear before you can inspect them.
macOS runtime diagnostics
TraceRig captures file activity, logs, process events, and network behavior, then turns them into timelines, diffs, exports, and diagnostic insight.
The problem
Startup failures, regressions, and intermittent macOS behavior often disappear before you can inspect them.
Logs, files, process trees, and sockets live in separate places, with separate tools and separate timelines.
Developers need to compare a known-good run against a broken run and find the first meaningful divergence.
The solution
TraceRig records what a target app does while it runs, normalizes events into a searchable model, and gives you a practical way to answer: what changed, what looked unusual, and what happened first?
Core features
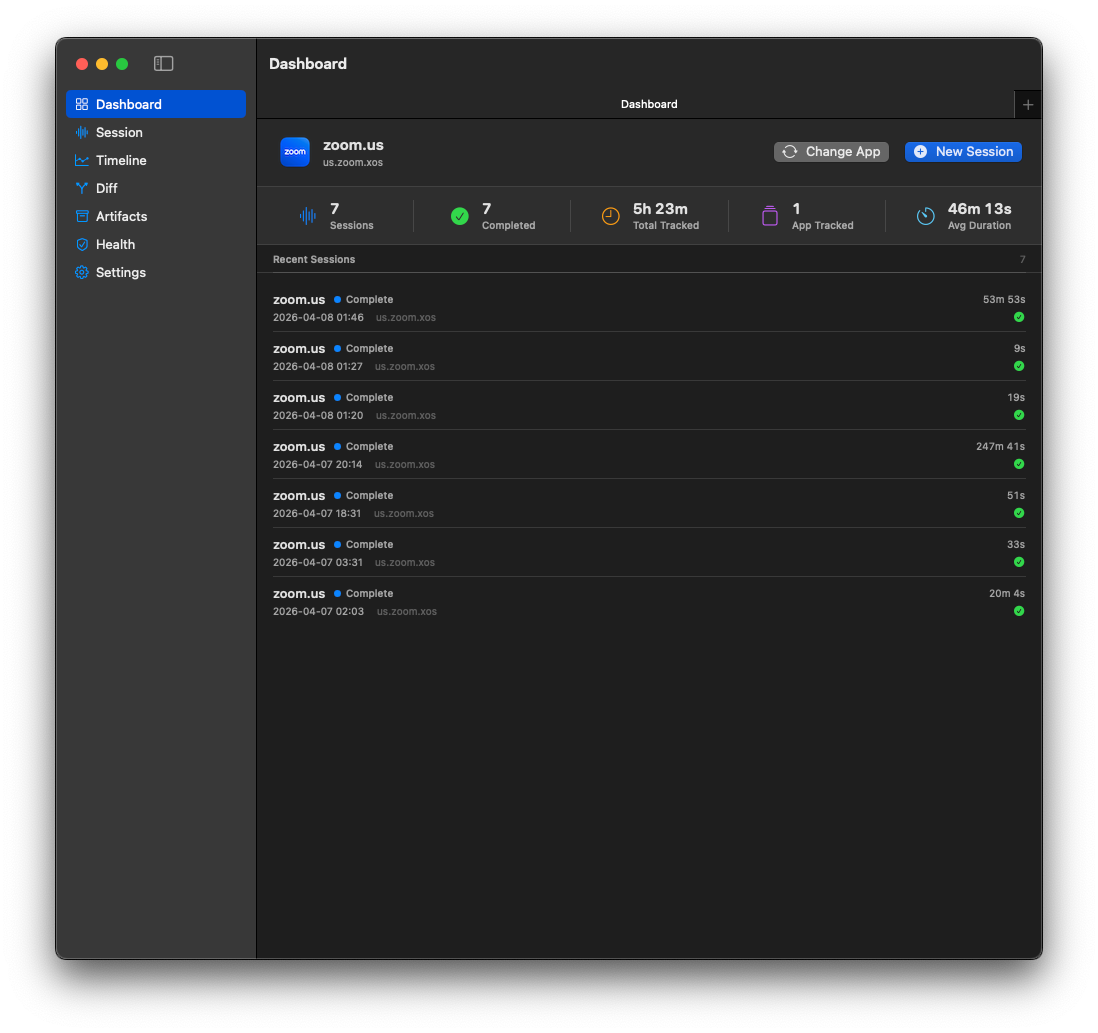
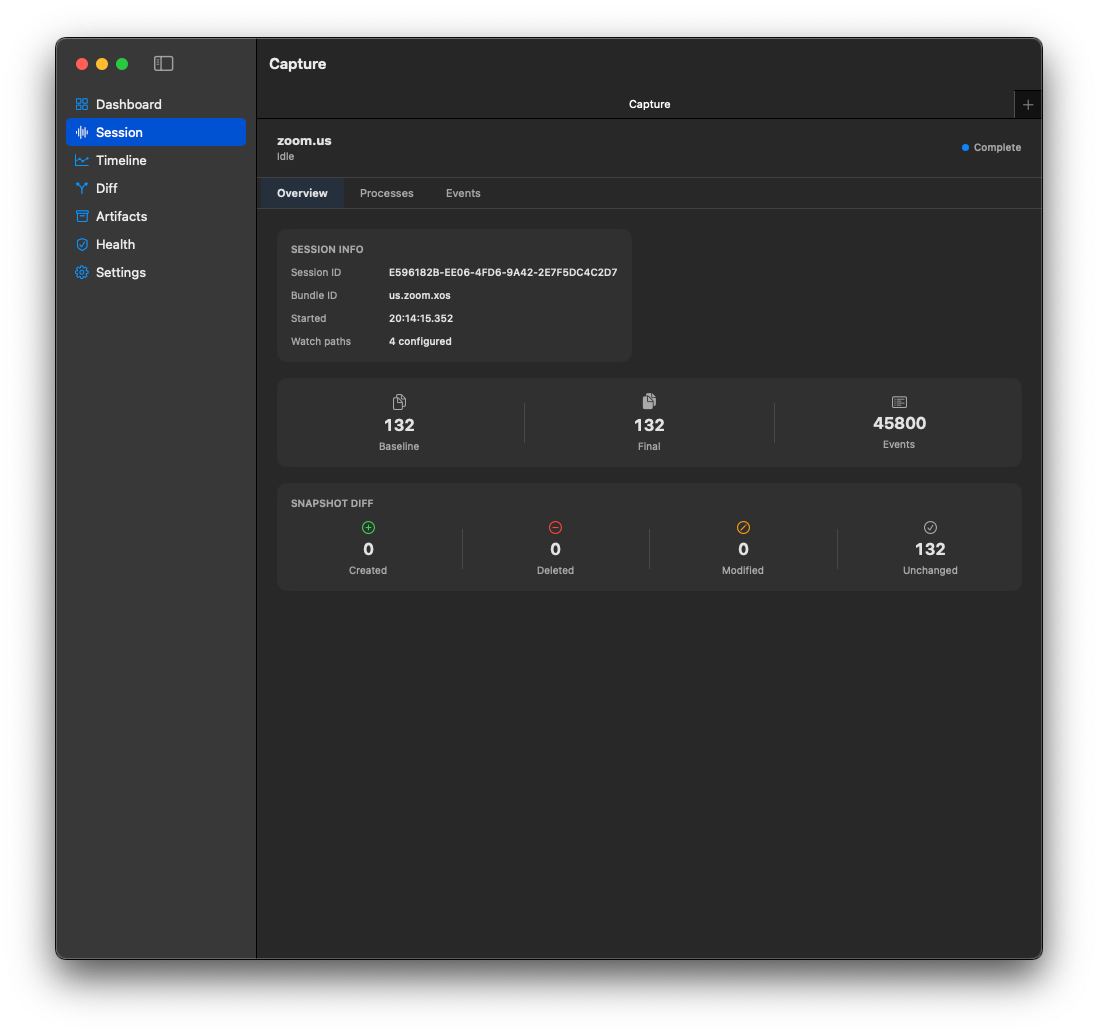
Select a running app by bundle ID. TraceRig stores baseline and final filesystem snapshots and tracks runtime events during the session.
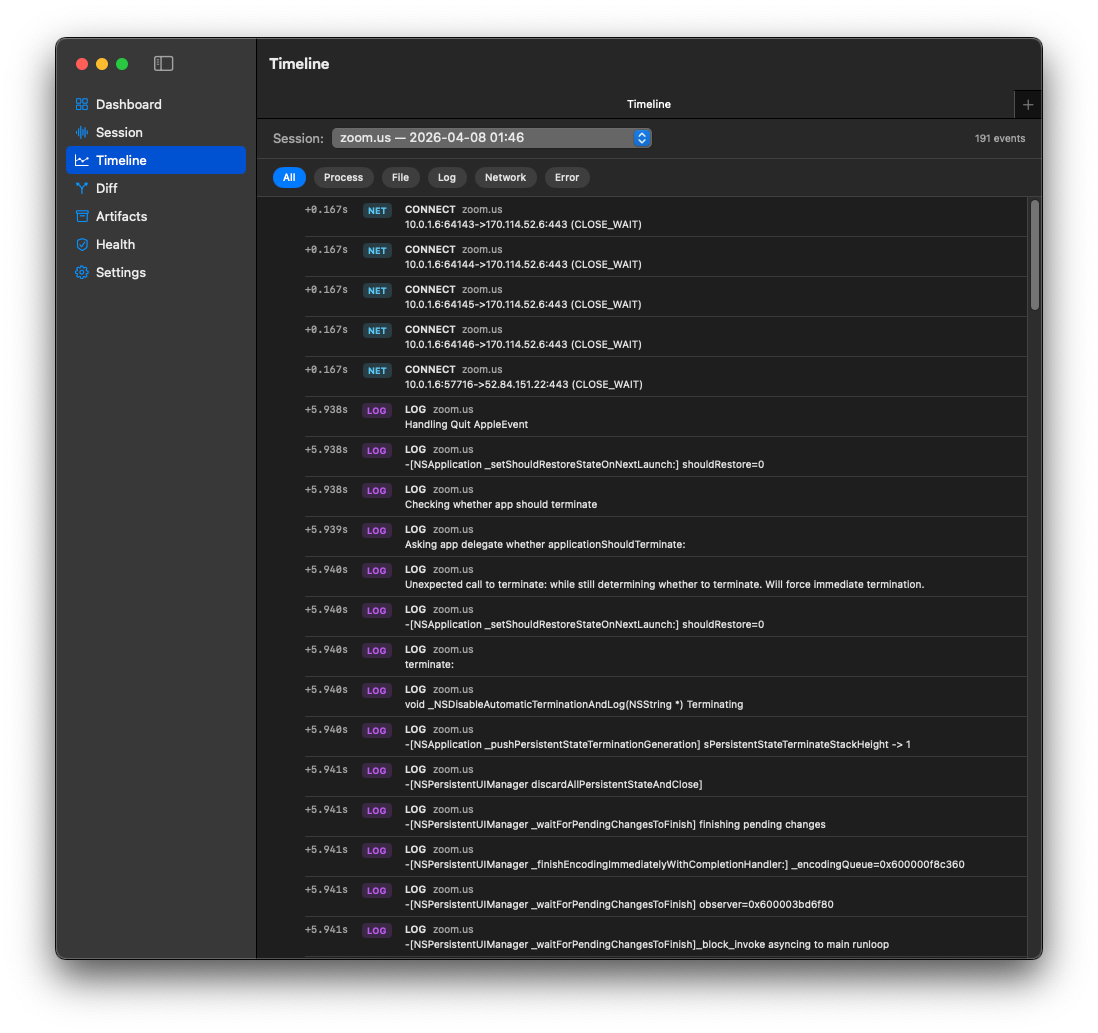
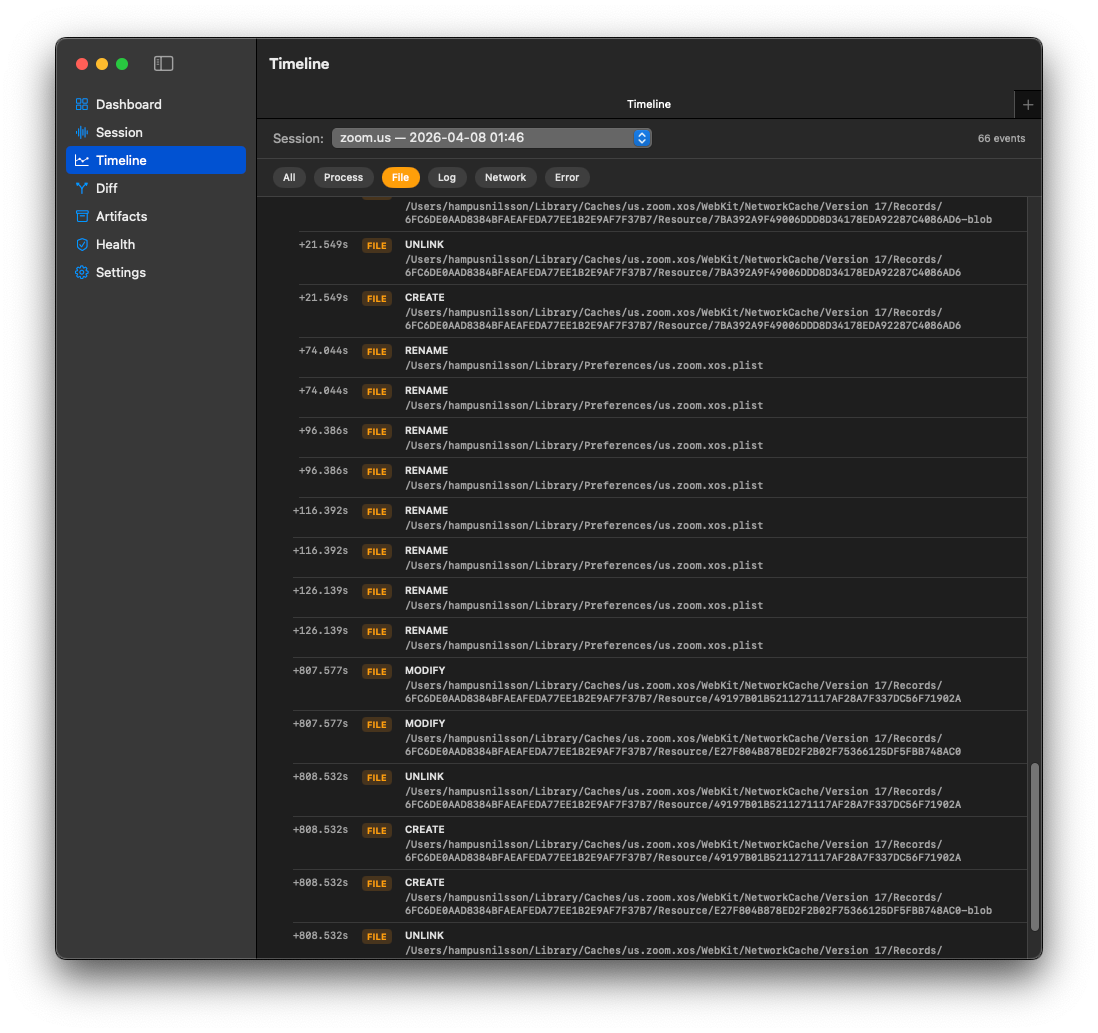
Filter a chronological event stream by process, file, log, network, or error. Event details include metadata and likely causal links.
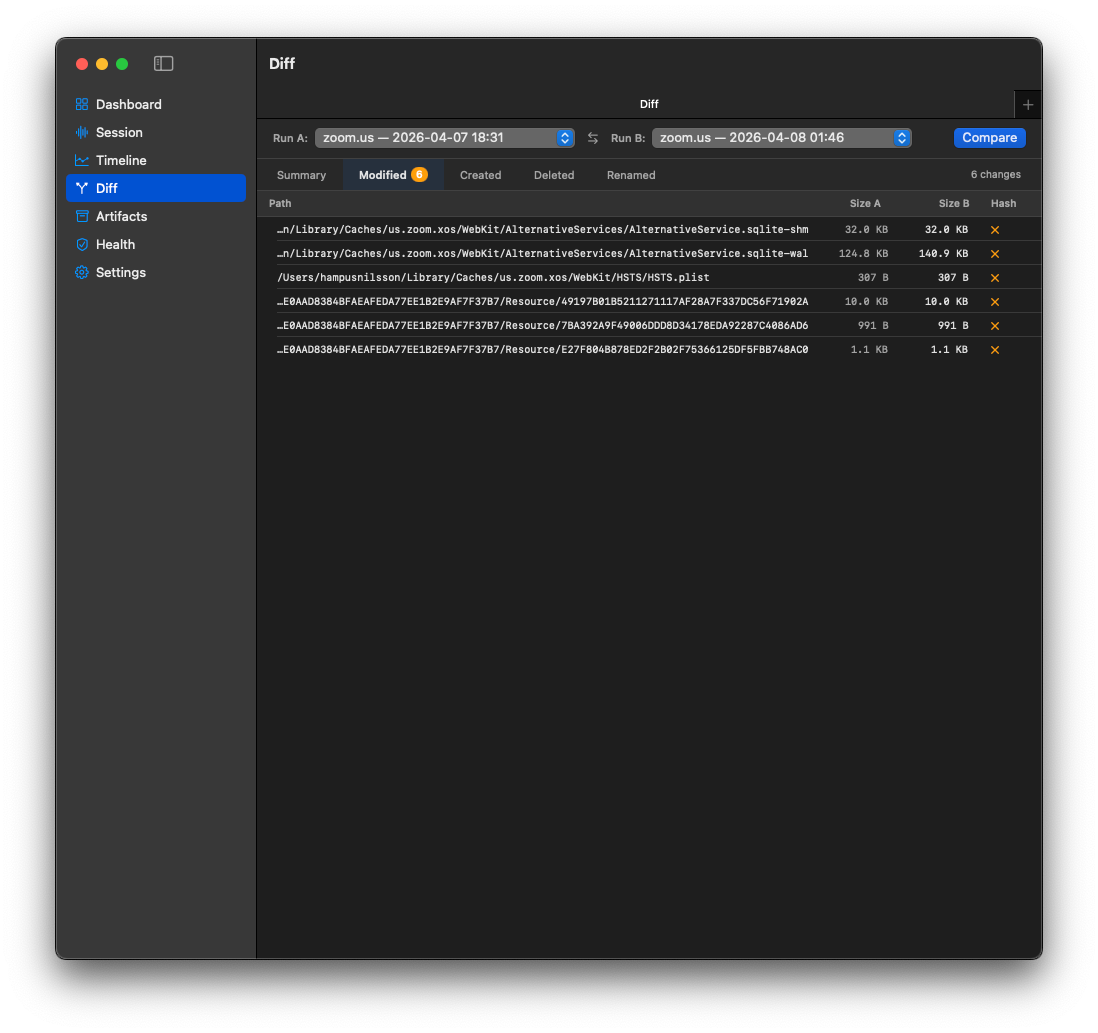
FSEvents captures create, unlink, rename, and modify activity. Snapshot diffs surface created, deleted, modified, renamed, and unchanged files.
TraceRig streams macOS unified logs for the target process and maps fault, error, default, and debug output into normalized events.
A live process tree follows descendant PIDs and emits EXEC and EXIT events as child processes appear or terminate.
Network probes observe TCP and UDP socket state. The current status also marks lifecycle-aware network flow capture as complete.
Compare completed sessions by file diff and behavior diff, including hosts, processes, actions, anomalies, and first divergence signals.
Completed milestones include explain-session summaries, anomaly scoring, deterministic behavior signatures, and an insight dashboard.
How it works
Choose the target app, start capture, and let TraceRig collect runtime signals while the issue is reproduced.
Review the session overview, process tree, timeline filters, file activity, logs, and network observations.
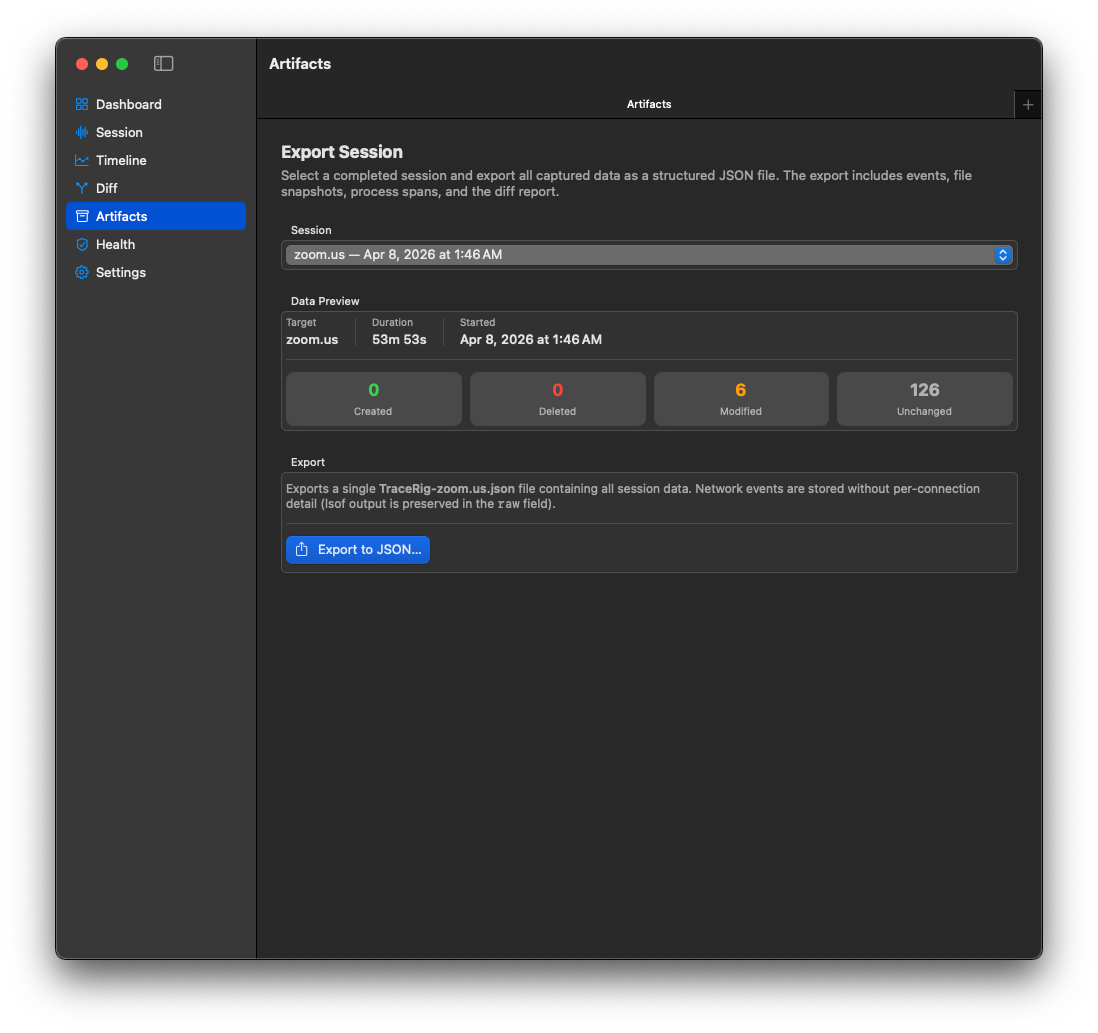
Compare clean and broken sessions, export JSON artifacts, and use summaries, anomalies, and divergence points to explain the run.
Screenshots
Captions describe what is visible in the supplied screenshots.
Use cases
Technical principles
Built with Swift, SwiftUI, CoreServices/FSEvents, unified logs, sysctl, lsof, SQLite3, and optional DTrace.
Phase 3 network constraints explicitly rule out packet modification, TLS bypass, MITM interception, and certificate injection.
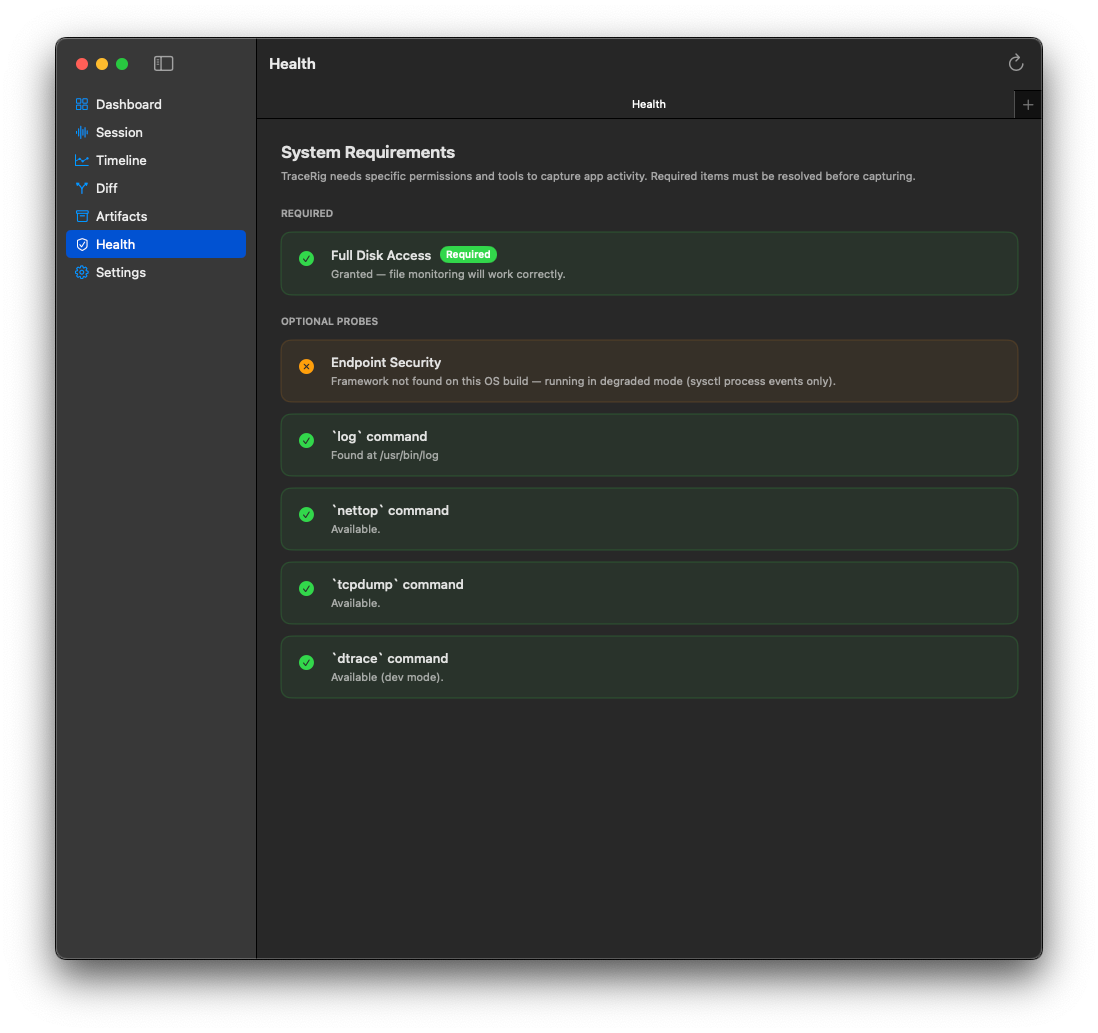
Optional probes can be unavailable or restricted without breaking the rest of the capture pipeline.
The app uses local persistence through SQLite repositories. TODO: confirm any broader local-first positioning before making stronger privacy claims.
Roadmap and current status
Summarized from PROJECT_STATUS.md.
Ready to inspect the run?
Use it when logs alone are too flat, reproduction is slippery, and comparing sessions matters more than guessing.